
Varinder Singh
Director
![]() Call Us On +91 9023981745
Call Us On +91 9023981745
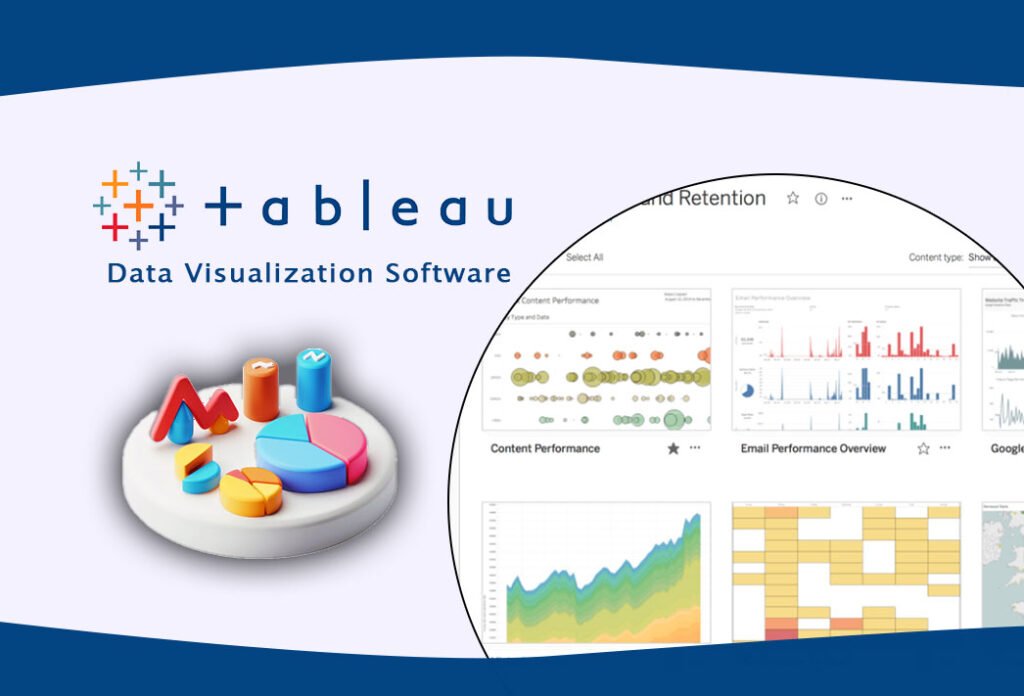
Learn to create interactive dashboards and powerful visualizations with Tableau. From connecting data to advanced analytics, this course helps you analyze trends, uncover insights, and make data-driven decisions with ease. By the end, you’ll confidently present data in a visually compelling way that drives real impact!
(25 Reviews)
Total Contents
Level
Learn the basics of Tableau and how to connect various data sources.
Clean, shape, and blend data for accurate analysis.
Create engaging charts, graphs, and maps to represent data effectively.
Design interactive dashboards and craft compelling data stories.
Use AI-powered insights, calculations, trend lines, and forecasting for deeper data analysis.
Director
A passionate educator and visionary leader with 25+ years of experience in computer education and training. They believe in practical learning that prepares students for real-world challenges.
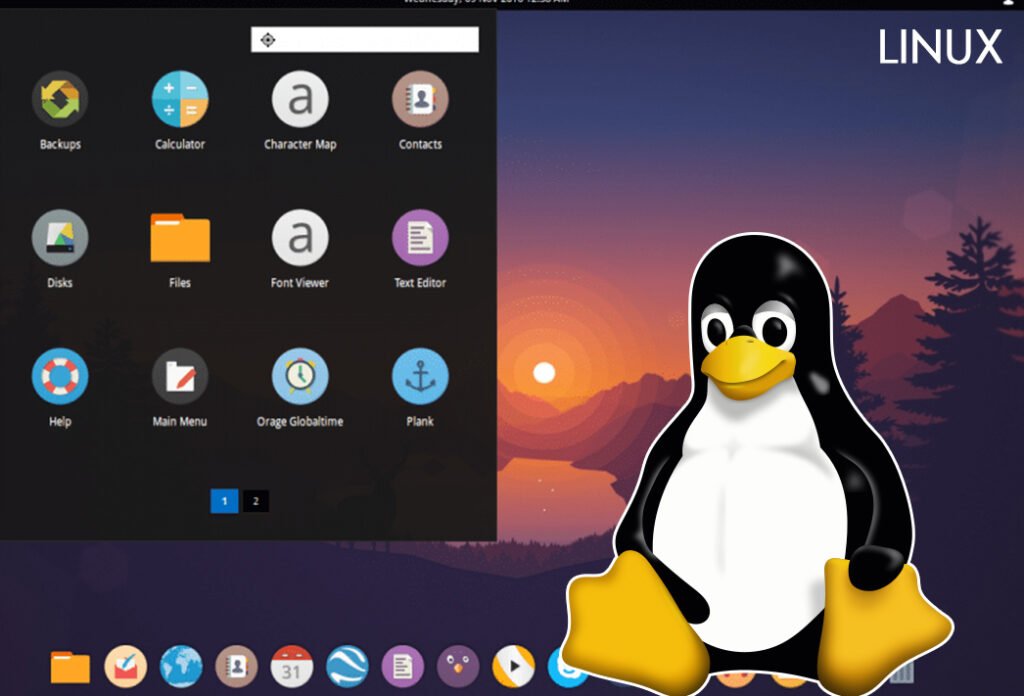
Beginner Level
60 Hours
Learn essential topics like installation, command-line operations, file system management, networking, and more...
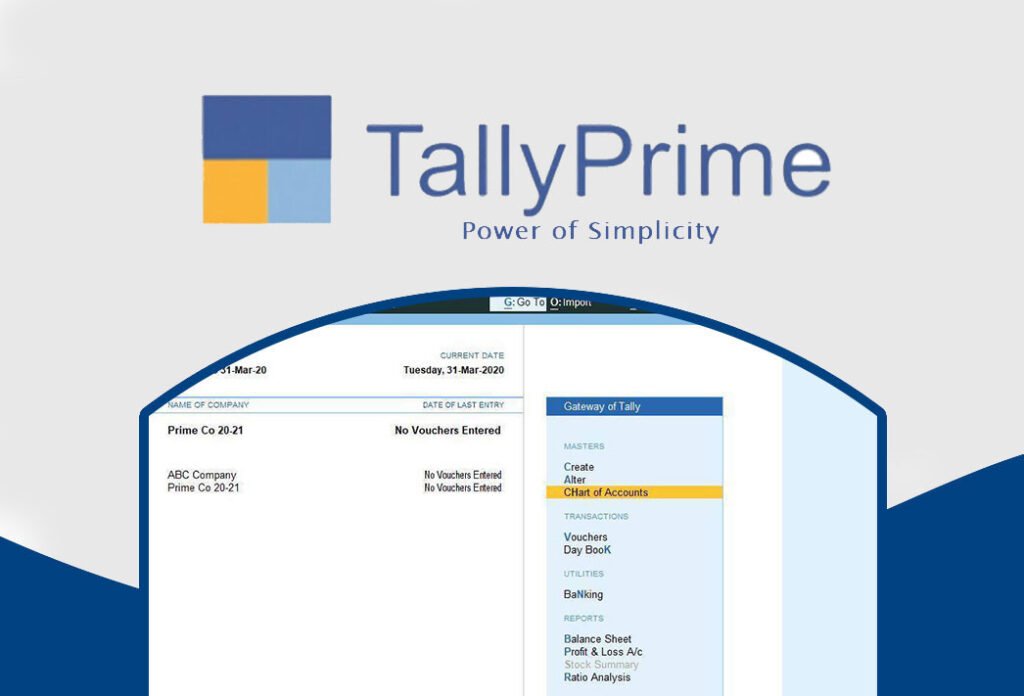
Advanced Level
30 Hours
This course teaches accounting, GST, inventory management, and financial reporting - essential for business finances .
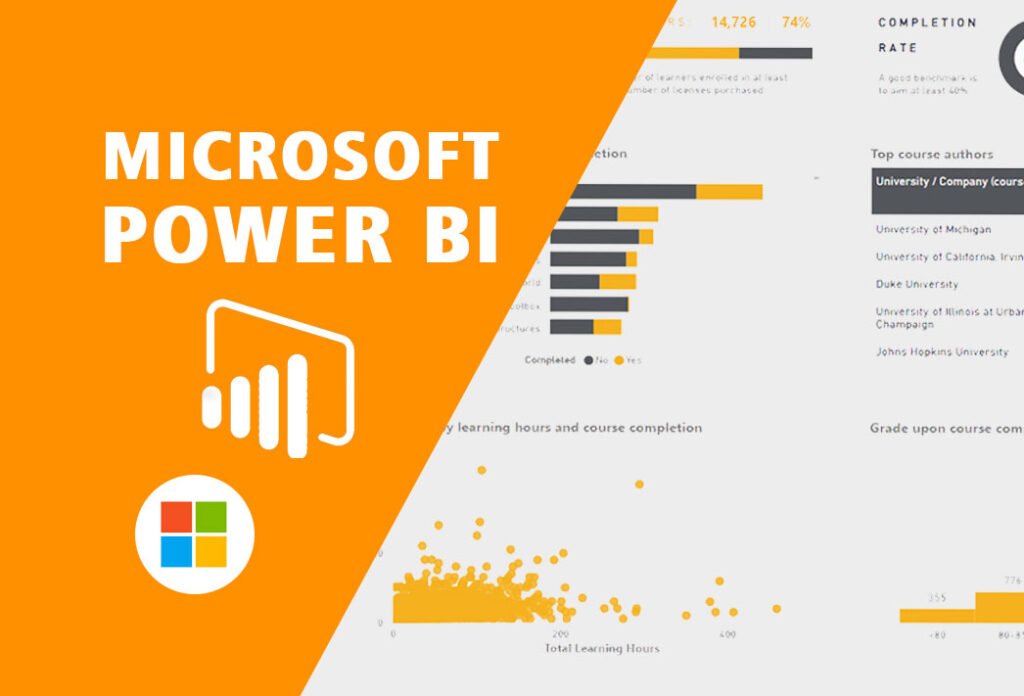
Beginner Level
30 Hours
Learn to create interactive dashboards and powerful visualizations. This course makes database easier to understand.
Director
I will be back soon